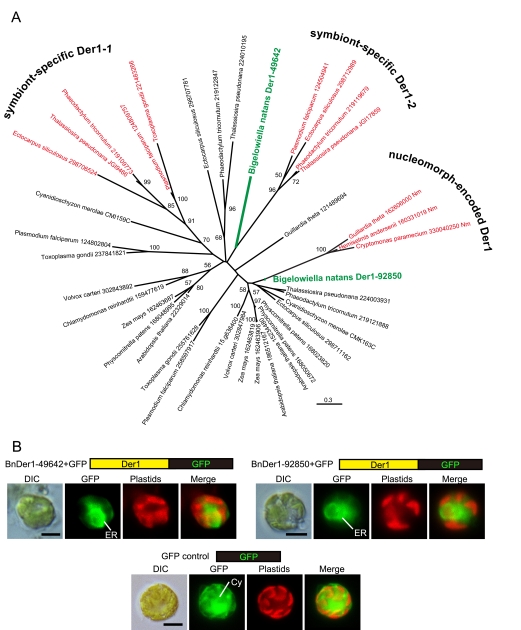
Fig 1.
Unrooted maximum-likelihood phylogenetic tree of Der1-like proteins and subcellular localizations of B. natans Der1-like proteins. (A) B. natans sequences are shown in green, and Der1 sequences of putative translocons at the second plastid membrane are indicated in red. The numbers next to the species names indicate GenBank, JGI, or C. merolae genome identifiers. The values at nodes are the bootstrap support values and are indicated only when they are higher than 50%. The scale bar represents the estimated number of amino acid substitutions per site. (B) GFP localization of a transformed cell expressing BnDer1-49642-GFP, BnDer1-92850-GFP, and control GFP, respectively. The pictures labeled “GFP” and “Plastids” show GFP fluorescence (green) and chlorophyll autofluorescence (red), respectively. DIC, differential interference contrast image; SP, signal peptide; ER, endoplasmic reticulum; Cy, cytoplasm. Scale bar, 5 μm.

