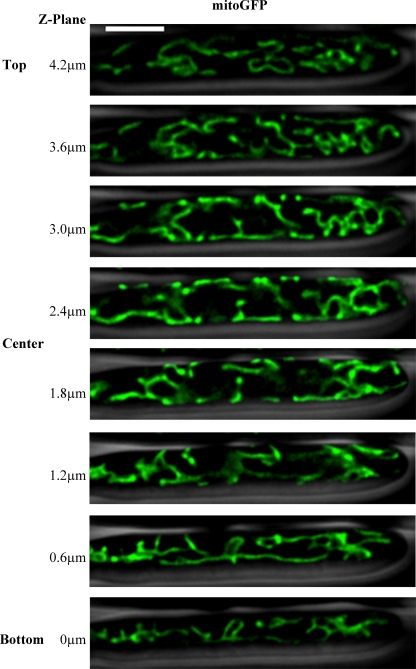
Fig 1.
Mitochondria form tubular networks in A. gossypii. Cells expressing mitoGFP (AG469) were visualized using wide-field fluorescence microscopy. Images were captured at 0.3-μm sections throughout the Z dimension of the cell, and the stack of images was deconvolved. Individual Z slices are displayed in 0.6-μm increments, with the cell outline from phase-contrast microscopy shown in gray. The scale bar represents 5 μm.

