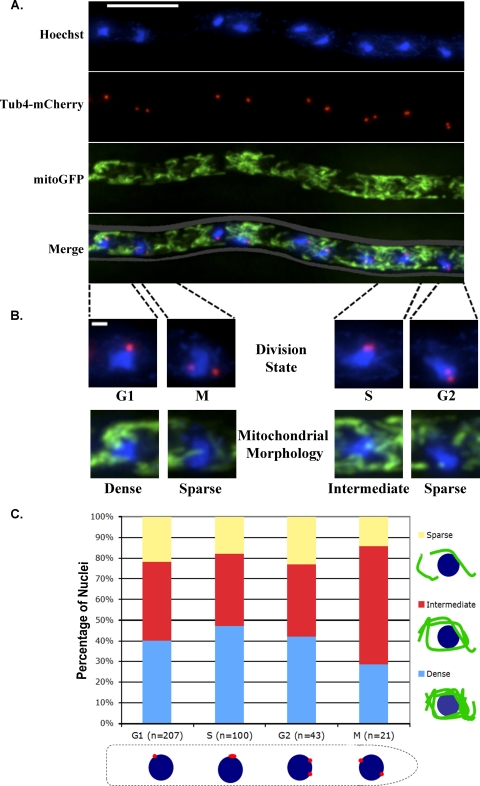
Fig 2.
Heterogeneity of mitochondrial morphology is independent of nuclear division. (A) Cells expressing mitoGFP to visualize mitochondria and Tub4-mCherry to visualize spindle pole bodies (SPBs) (AG469) were fixed, and DNA was stained with Hoechst dye. mitoGFP signal is shown in green, SPBs are shown in red, and nuclei are shown in blue. The scale bar represents 10 μm. (B) Nuclei were scored for division state using SPBs as a marker and for the morphology of mitochondria immediately surrounding a nucleus. Individual nuclei are shown to demonstrate scoring categories. The scale bar represents 1 μm. (C) Three hundred seventy-one nuclei were scored for division state and the morphology of surrounding mitochondria.

