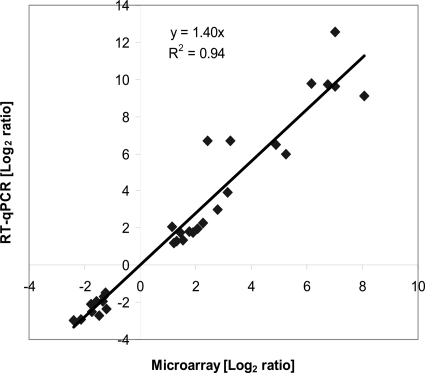
Fig 2.
Comparison of log2 expression ratios of 30 selected differentially regulated genes measured by using microarrays and RT-qPCR. Positive and negative log2 expression ratios represent up- and downregulation during FNL, respectively. Each data point is calculated from averages of biological triplicates.

