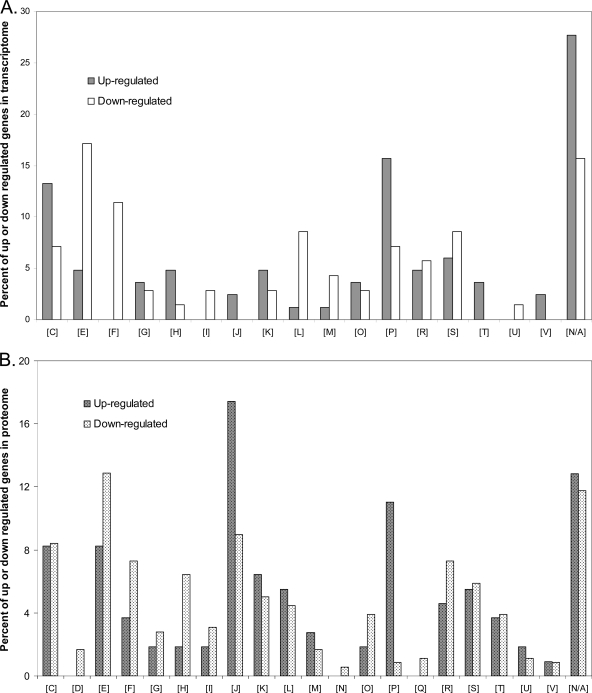
Fig 3.
COG distribution of differentially up- and downregulated genes in the transcriptome (A) and proteome (B). Transcripts that changed by 2-fold or greater and that had an FDR of less than 1% are included in the transcriptome, and proteins that changed by 1.3-fold or greater are included in the proteome. The percentages represent the number of genes that are in a category relative to the respective total number of genes that were up- or downregulated. The COG abbreviations are as follows: [C], energy production and conversion; [D], cell cycle control, cell division, and chromosome partitioning; [E], amino acid transport and metabolism; [F], nucleotide transport and metabolism; [G], carbohydrate transport and metabolism; [H], coenzyme transport and metabolism; [I], lipid transport and metabolism; [J], translation, ribosomal structure, and biogenesis; [K], transcription; [L], replication, recombination, and repair; [M], cell wall/membrane/envelope biogenesis; [N], cell motility; [O], posttranslational modification, protein turnover, and chaperones; [P], inorganic ion transport and metabolism; [Q], secondary metabolite biosynthesis, transport, and catabolism; [R], general function prediction only; [S], function unknown; [T], signal transduction mechanisms; [U], intracellular trafficking, secretion, and vesicular transport; [V] defense mechanisms; [N/A], unclassified.

