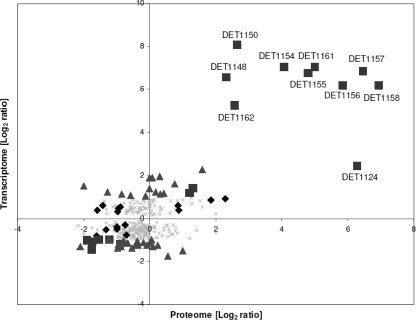
Fig 4.
Plot of log2 expression ratios of selected genes from transcriptomic data against proteomic data. In cases where no peptides were detected in the proteome in all three biological replicates, a value of 1 is assigned as the pseudo-spectrum count to avoid infinity and allow a ratio to be calculated. ■ represents genes that were differentially regulated in the proteome and in the transcriptome by 2-fold or greater, ♦ represents genes that were differentially regulated in the proteome and in the transcriptome but by less than 2-fold, ▲ represents genes that were differentially regulated by 2-fold or greater in the transcriptome but were not differentially regulated in the proteome, and × represents genes that were differentially regulated by less than 2-fold in the transcriptome and were not differentially regulated in the proteome. Genes that are related to nitrogen fixation are labeled with their locus tags.

