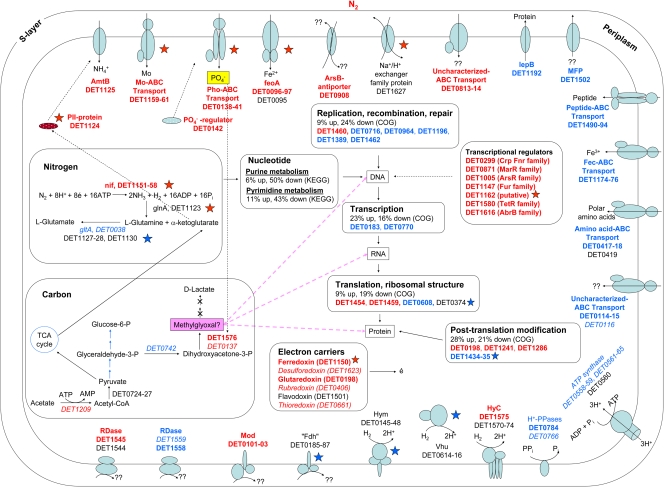
Fig 5.
Conceptual model of the response of strain 195 to FNL. Red text and blue text indicate differential upregulation and downregulation in the transcriptome, respectively, and black indicates insignificant differential expression (FDR of >1%). Boldface and italic fonts represent expression ratios of 2-fold or greater and less than 2-fold, respectively. Red and blue stars indicate proteins that are differentially up- and downregulated by 1.5-fold or greater, respectively. Red and blue arrows and lines indicate metabolic pathways or cycles that are up- and downregulated, respectively. All genes in selected COG categories and KEGG pathways were examined to determine their direction of change in the transcriptome, and the indicated percentages are the relative fractions that were differentially up- or downregulated with an FDR of less than 1%. Two homologs of the Fe2+ transporter are present in strain 195 (DET0095 to DET0097 and DET1503 and DET1504), and analyses of the transcriptome and proteome have separately identified these two homologs as being differentially regulated. TCA, tricarboxylic acid; CoA, coenzyme A.

