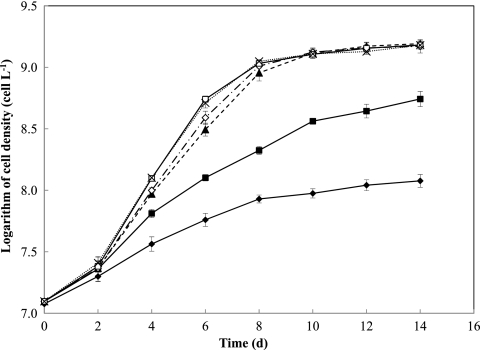
Fig 2.
Growth curves in batch cultures of M. aeruginosa at different total Fe concentrations in Fraquil*. Total Fe concentrations were varied from 10 nM to 10 μM; all other medium components were constant. Symbols represent the means and error bars represent the standard deviations from duplicate incubations (filled diamonds, 10 nM [Fe]T; filled squares, 20 nM [Fe]T; filled triangles, 50 nM [Fe]T; open diamonds, 100 nM [Fe]T; open squares, 1 μM [Fe]T; and crosses, 10 μM [Fe]T).

