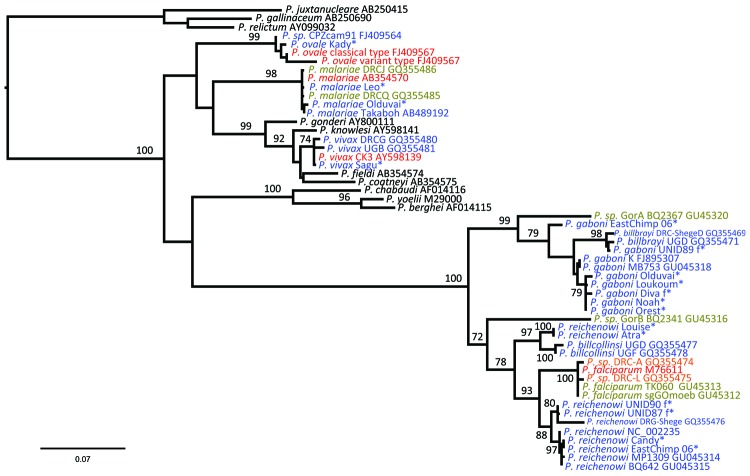
Figure 1.
Maximum-likelihood trees of Plasmodium spp. obtained from the analysis of a 1,087-bp CytB alignment. Blue indicates sequences determined from chimpanzee hosts; green, bonobos; gray, gorillas; and red, humans. Black indicates sequences obtained from nonprimate hosts. Plasmodium spp. sequences derived from chimpanzees in this study are marked with an asterisk. Bootstrap values are shown when >70. The tree was rooted using avian plasmodium sequences. Accession numbers of all sequences used are shown in the Table. Scale bar indicates nucleotide substitutions per site.

