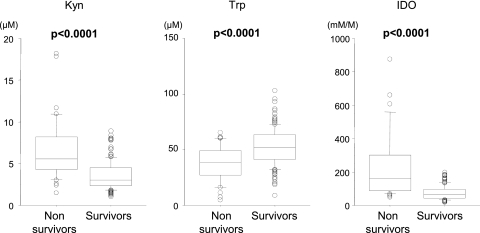
Fig 2.
Serum concentrations of Kyn and Trp and IDO activity in nonsurvivors and survivors. The P values were determined by the Wilcoxon/Kruskal-Wallis test. The upper and lower portions of the boxes indicate 25th and 75th percentiles, respectively, and the horizontal lines within the boxes indicate the 50th percentile (median). The horizontal lines above and below the boxes indicate the 1.5 interquartile range of the lower and upper quartiles, respectively.

