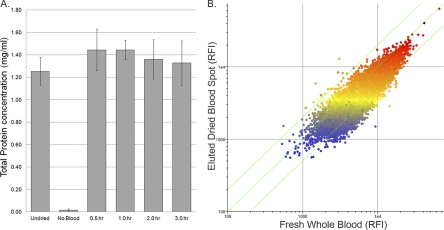
Fig 2.
Analysis of serum protein recovery and immunoglobulin reactivity observed in dried whole-blood specimens. (A) Total protein recovery from Whatman 903 protein saver cards. The total protein content of the 1:100-diluted human serum samples was measured with the NanoDrop spectrophotometer. Data presented are the average of four separate dried-blood spots from the same donor and are representative of recoveries from different donors (data not shown). (B) Scatter plot showing the correlation between the immunosignatures of the fresh mouse whole-blood sample (x axis) and dried mouse whole-blood sample on collection paper (y axis) (R2 = 0.832) represented by raw fluorescence intensities (RFIs). The black dot indicates the immunizing peptide. The color used to plot data points represents the relation of the data point to the median intensity of the eluted dried-blood spot (yellow spots). Red represents features three times above the median value, and blue represents features three times below the median. Diagonal green lines represent the values that are 1.3-fold different between the two samples. Data presented are representative of three separate peptide-KLH conjugates.

