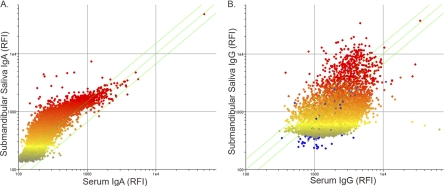
Fig 4.
Comparison of submandibular saliva to dried-blood spots for IgA (A) and IgG (B). Saliva samples were compared to dried-blood spots collected at the same time from a single human donor. Raw intensities are plotted, and color represents the median intensity, where yellow dots represent features at the median for the saliva samples. Saliva is plotted on the vertical axis, and the dried-blood spot is plotted on the x axis. Data plotted are from a single human donor and are representative of four individual donors. RFI, raw fluorescence intensity.

