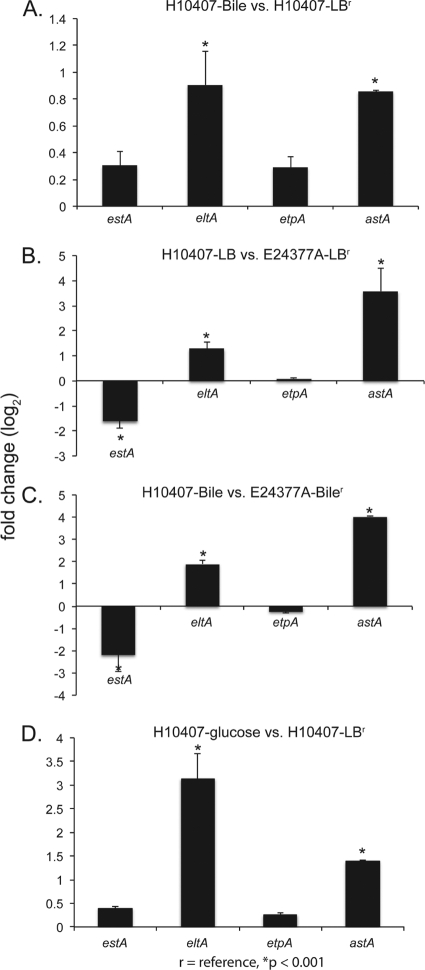
Fig 3.
Identification of transcriptional differences between prototype ETEC strains. To determine the impact of strain on the transcriptional response in ETEC isolates E24377A and H10407, we used qRT-PCR to examine 4 genes. Columns with an asterisk indicate a significant P value of <0.001 as calculated by Student's t test. Error bars represent standard deviations of the results determined with at least 2 biological replicates. (A) Differential expression between H10407 grown in LB and in LB-bile, demonstrating significantly increased expression of eltA and astA. (B) H10407 expression in LB compared to E24377A expression in LB, with significantly increased expression of eltA and astA. (C) Differential expression between H10407 and E24377A grown in LB-bile, demonstrating a significantly greater bile-related response of the eltA and astA genes in H10407. (D) Differential expression of H10407 grown in either LB or LB-glucose. This panel highlights the previously published response of H10407 to glucose, which differs significantly from that in E24377A (Fig. 1).

