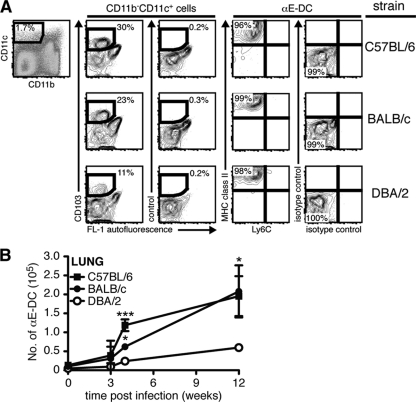
Fig 3.
αE-DC populations in the lungs of naïve and M. tuberculosis-infected mice. (A) Groups of C57BL/6, BALB/c, and DBA/2 mice were infected with a low dose of virulent M. tuberculosis via the respiratory route. Single-cell suspensions were prepared from infected lungs 12 weeks p.i. and stained for CD45.2, CD19, CD11b, and CD11c (left and data not shown). αE-DCs were identified in the CD11b− CD11c+ gate (pregated on CD45.2+ CD19− cells [data not shown]) compared to an isotype control MAb (middle). The gated αE-DCs were examined for cell surface expression of Ly6C and MHC class II compared to isotype controls (right). The plots show lung cells from one representative experiment. (B) Graph showing the absolute numbers of αE-DCs in uninfected and M. tuberculosis-infected C57BL/6, BALB/c, and DBA/2 mice. Statistically significant differences between C57BL/6 and DBA/2 mice, or between BALB/c and DBA/2 mice, are indicated. At week 4 p.i., we also detected a statistically significant difference between C57BL/6 and BALB/c mice (**). The cell surface phenotype and the absolute number of αE-DCs were determined in nine separate experiments with 2 or 3 mice per group in each experiment. The results were pooled from all replicate experiments. The graphs show means ± SD. *, P < 0.05; **, P < 0.01; ***, P < 0.001 by one-way ANOVA with Bonferroni posttest.

