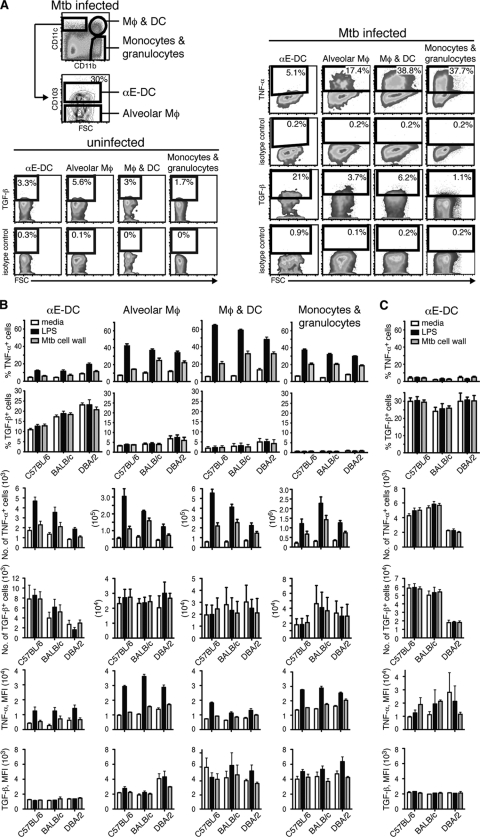
Fig 5.
αE-DC cytokine profile in M. tuberculosis (Mtb)-infected mice. Three mouse strains (C57BL/6, BALB/c, and DBA/2) were infected with a low dose of aerosolized virulent M. tuberculosis. Three or 12 weeks p.i., total lung cells were kept in medium or stimulated with LPS or M. tuberculosis cell wall extract. (A) The cell surface was stained for CD45.2 and CD19 (data not shown) and for CD11b, CD11c, and CD103 (top left). TNF-α and TGF-β production was compared between αE-DCs; CD11b− CD11c+ CD103− cells, which may contain alveolar Mϕ; CD11b+ CD11c+ cells, which contain both activated Mϕ and DCs; and CD11b+ CD11c− cells, which are monocytes and granulocytes right and bottom (left). The plots show M. tuberculosis cell wall extract-stimulated lung cells from uninfected mice or lung cells analyzed 3 weeks p.i. from one representative experiment. FSC, forward light scatter. (B) Bar graphs showing the percentages (top two rows), absolute numbers (middle two rows), and mean fluorescence intensity (MFI) (bottom two rows) of TNF-α- or TGF-β-producing αE-DCs in week 3 p.i. compared to the myeloid cell subsets shown in panel A. (C) Lung cells from C57BL/6, BALB/c, and DBA/2 mice were prepared 12 weeks p.i. as described above and analyzed for TNF-α and TGF-β production. The functional potential of αE-DCs was determined in four separate experiments with 2 or 3 mice per group in each experiment. The results were pooled from all replicate experiments. The graphs display means and SEM.

