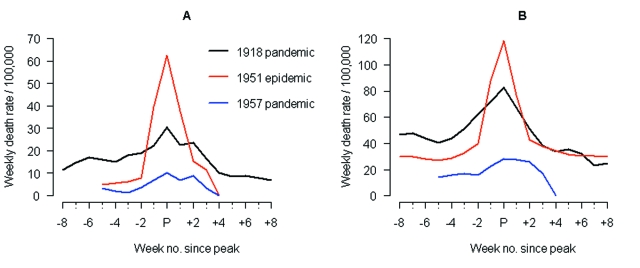
Figure 1.
Comparison of 1951 epidemic (A/H1N1) with the 1918 and 1957 pandemics (A/H1N1 and A/H2N2, respectively) in Liverpool, England. Time series of weekly death rates from A) respiratory causes (pneumonia, influenza and bronchitis) and B) all causes. Epidemics were aligned at the week of peak mortality (peak week = week ended Feb 22, 1919; Jan 13, 1951; Oct 12, 1957). The 1918 pandemic occurred in 3 waves in Liverpool (summer 1918, autumn 1918, winter 1919); the "third wave" was associated with the highest death rate and is represented here.

