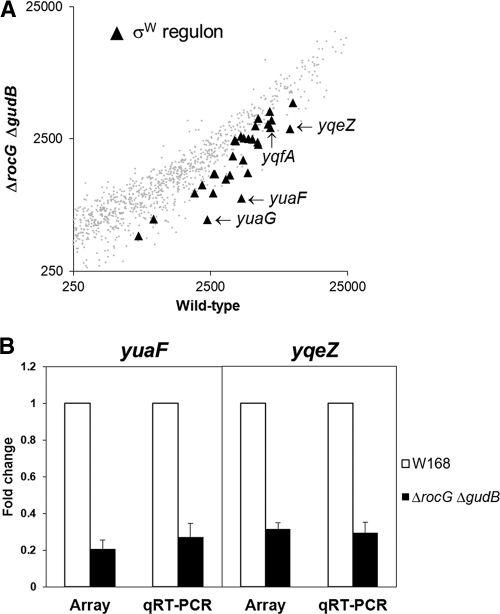
Fig 5.
A rocG null mutant displays decreased expression of the σW regulon. (A) Gene expression variation as measured by cDNA microarray analysis under nonstress conditions. RNA was extracted from cells grown in LB medium to an OD600 of 0.4. Black triangles indicate the σW regulon genes. (B) Quantitative real-time RT-PCR analysis of yuaF and yqeZ expression. Data were expressed as fold change relative to wild-type cells. The level of 23S rRNA was used as a normalization control. Three independent experiments were performed for each gene, and the standard deviation is indicated by error bars.

