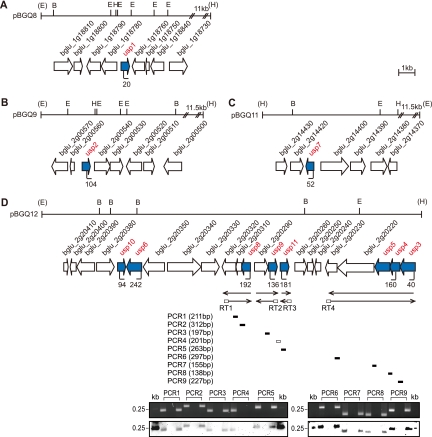
Fig 3.
Genetic organization of usp genes in B. glumae. (A to C) Schematic organization of the usp1, usp2, and usp7 genes. (D) Schematic organization of the usp3, usp4, usp5, usp6, usp8, usp9, usp10, and usp11 genes. Arrows below transcript arrows represent the direction and extent of cDNA. The short thick bars below the reverse transcription (RT) arrows indicate the nine PCR products from the corresponding RT reactions. The expected sizes of the PCR products are indicated in parentheses for each PCR. Shown are data for agarose gel analysis (top) and Southern hybridization analysis (bottom) of the RT-PCR products. Southern hybridization was performed by using pBGQ12 as probe DNA. The first lane used chromosomal DNA, the second lane used total RNA, and the third lane used cDNA as a template for each PCR. Vertical bars in the map denote the positions and orientations of the Tn3-gusA insertions. The restriction enzyme sites are indicated as follows: E, EcoRI; B, BamHI; H, HindIII.

