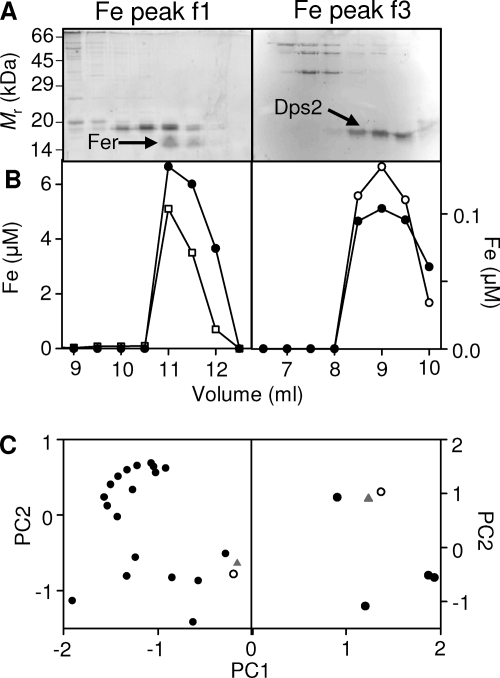
Fig 2.
Identification of metalloproteins that constitute the cytosolic iron pools f1 and f3. (A) To identify the proteins binding the iron in the major detectable cytosolic pools (Fig. 1), aliquots of fractions across the metal peaks f1 (left) and f3 (right) were resolved by SDS-PAGE, visualized with Sypro Ruby, and scanned for fluorescence intensity. Abundances of all proteins in all fractions were estimated by densitometry. Proteins excised for PMF are indicated (arrows). The migration pattern of protein standards is shown on the left. (B) Protein abundance profile (closed symbols), with arbitrary units, of a single protein species (Fer [left] or Dps2 [right]) that most closely correlated with the corresponding iron distribution (open symbols). (C) PCA comparing variations in iron distribution (triangles) of the f1 pool (left) and the f3 pool (right) compared with each protein observed in the fractions (circles). The protein whose distribution most closely matched that of the iron is shown by open symbols.

