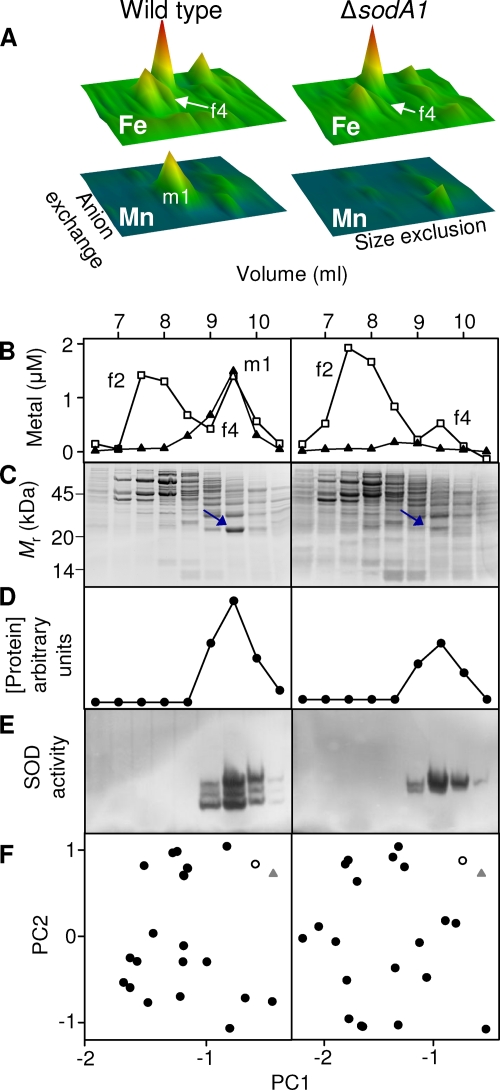
Fig 3.
SodA1 is associated with manganese and iron in vivo, whereas SodA2 is associated only with iron. (A) Cytosolic iron (upper panels) and manganese (lower panels) profiles, analogous to those shown in Fig. 1, from soluble extracts (50 mg total protein) prepared from wild-type (left panels) and ΔsodA1 mutant (right panels) B. anthracis. The data shown here are from single biological replicates, and all axes are identical to those illustrated in Fig. 1. The major manganese pool (m1) is absent in the ΔsodA1 profile. (B) Chromatographs showing comigration of the manganese pool (m1) with an iron pool (f4) on size exclusion chromatography of the 300 mM NaCl anion-exchange fraction in wild-type extract (left) and the absence of the manganese pool (m1) and a decrease in the associated iron pool (f4) in ΔsodA1 extract (right). (C) SDS-PAGE analyses of size exclusion fractions from panel B, stained with Sypro Ruby, as in Fig. 2. The migration pattern of protein standards is shown on the left. (D) Abundance of the single protein species (circles) that most closely correlated with the corresponding manganese distribution (m1) and iron distribution (f4) in fractions from the wild type (left) and with the iron distribution (f4) in fractions from the ΔsodA1 mutant (right). (E) In-gel SOD activity assays using the same fractions indicate the presence of SodA1 and SodA2 in wild-type extracts (left) and the presence of SodA2 in extracts from the ΔsodA1 strain (right). (F) PCA comparing variation in the distribution of iron in f3 (triangles) of wild-type extract (left) or the ΔsodA1 mutant (right) with each protein observed in the gel (circles). The protein whose distribution best matched that of the corresponding metal is shown by open symbols. Although the wild-type data set shown here utilized the iron distribution for PCA, the same protein species was identified as the best match when the manganese distribution was used (data not shown).

