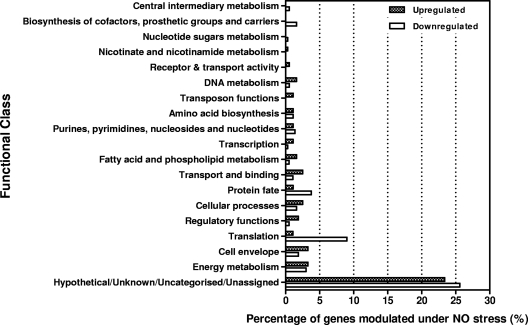
Fig 6.
Distribution of functions for genes affected by exposure of P. gingivalis to NO for 15 min. The genes that were differentially expressed (≤2-fold up- or downregulation and a P value of ≤0.05) were grouped by functional class according to the Los Alamos P. gingivalis genome database (www.oralgen.lanl.gov).

