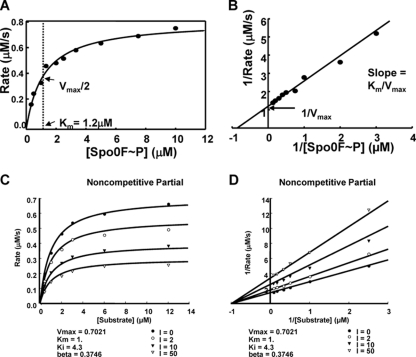
Fig 1.
Kinetic analysis of RapA dephosphorylation of Spo0F∼P and inhibition by PhrA. (A and B) The rates of dephosphorylation were obtained at 10 concentrations of Spo0F∼P (0.33, 0.5, 1, 1.33, 2, 2.5, 3.33, 5, 7.5, and 10 μM). Seven time points were taken for each substrate concentration, and the remaining Spo0F∼P was measured by exposing the gels to a PhosphorImager screen and analyzing the data with the ImageQuant software program. The percentage of remaining Spo0F∼P was plotted versus time, and the slope of each reaction (calculated as shown in Materials and Methods) multiplied by the substrate concentration gave the rate. The rate at each substrate concentration was plotted as a Michaelis-Menten (A) or Lineweaver-Burk (B) graph. (C and D) Time points of Spo0F∼P desphosphorylation by RapA were collected in the presence of four concentrations of the PhrA inhibitor and six concentrations of the substrate. The rates for each reaction were calculated as described above and in Materials and Methods. The best-fit analysis was carried out with the SigmaPlot software program, and the Michaelis-Menten (C) and the Lineweaver-Burk (D) graphs of the inhibition equations that best fit the data are shown. The remaining graphs of the curve fit analysis are shown in Fig. S1 in the supplemental material.

