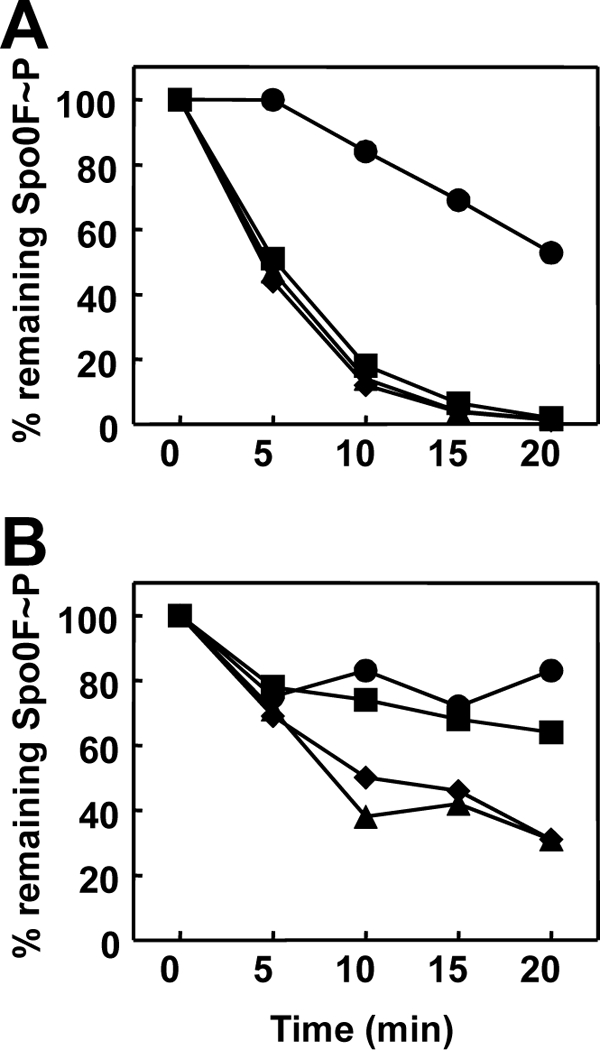
Fig 7.

Time course of Spo0F∼P dephosphorylation by RapAC4 (A) or RapAC5 (B) and inhibition by PhrA or PhrC. Spo0F∼P (2.5 μM) was incubated in the absence (●) or presence (▲) of the RapAC proteins (2.5 μM) and the PhrA (■) or PhrC (◆) peptide at a 5 μM final concentration. Samples were analyzed by 15% SDS-PAGE and quantitated by the Image Quant software program after exposure to a PhosphorImager screen.
