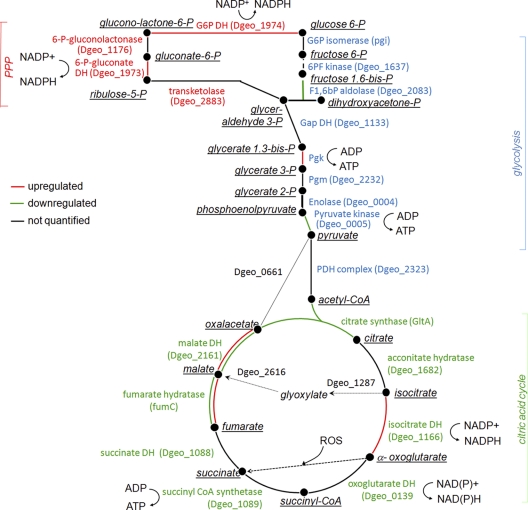
Fig 5.
Metabolic scheme for the main routes of carbon flow of D. geothermalis E50051 during active growth and nongrowth. The steps are color coded to illustrate enzyme expression change in nongrowing cells compared to growing cells. Red lines indicate upregulated enzymes in stationary-phase cells, and green lines indicate downregulated enzymes. When an enzymes appeared in double spots on the gel and the expression of the spots were different, the two lines are marked with corresponding colors. When no common protein name was available in the databases, the gene locus code is given (in parentheses).

