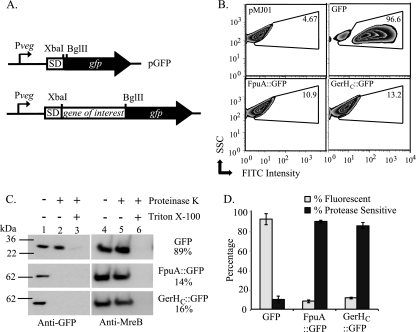
Fig 1.
Discrimination between intracellular and extracellular protein domains in B. anthracis. (A) Representation of the gene fusion site in the translational fusion vector pGFP. SD, Shine-Dalgarno sequence. (B) Flow cytometric analysis of GFP expression. Approximately 50,000 vegetative bacteria containing the control vector (pMJ01) (upper left) or plasmids expressing GFP alone (upper right), FpuA::GFP (lower left), or GerHC::GFP (lower right) were analyzed. The results are displayed as fluorescein isothiocyanate (FITC) intensity versus side scatter (SSC). The GFP+ gate was drawn to include cells with fluorescence intensity greater than that of the vector control (upper left). The percentage of GFP+ cells in each sample is displayed. (C) Protease sensitivity assays. Protoplasts expressing the indicated proteins were treated with 250 μg/ml PK for 5 min, with or without 2% Triton X-100. Immunoblots of samples to evaluate levels of full-length GFP fusion proteins (left) and the intracellular control MreB (right) are shown. Band intensities were quantified using AlphaEaseFC software, and GFP signals were normalized to MreB levels for each sample. Percent protease sensitivity as determined from normalized GFP band intensities of treated and untreated samples are indicated. (D) The means from three independent trials of flow cytometry (gray bars) and protease sensitivity assays (black bars) are shown. Error bars indicate standard errors of the means.

