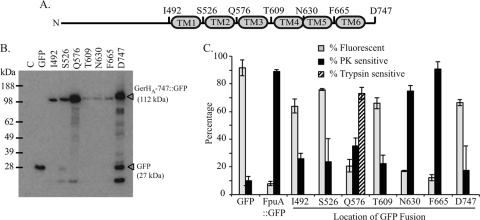
Fig 3.
Analysis of GerHA topology. (A) Model of GerHA with six putative transmembrane domains as determined by topology prediction. To test these putative TMs, C-terminal GFP fusions were made to full-length GerHA (D747) and six GerHA proteins truncated at the indicated locations. (B) Expression of GerHA fusion proteins in B. anthracis. Whole-cell lysates from bacteria expressing a vector control (lane C), GFP, or GerHA fusion proteins were analyzed by immunoblotting with anti-GFP antibodies to assess protein expression and stability. The predicted sizes of GFP and full-length GerHA-747::GFP are indicated. (C) Analysis of GerHA fusion proteins by flow cytometry and protease sensitivity assays. Flow cytometry was used to measure the fluorescence intensities of bacteria expressing control proteins (GFP or FpuA::GFP) or the GerHA fusion proteins. The percentage of GFP+ cells in each sample was determined as described for Fig. 1B (gray bars). Protease sensitivity assays were performed with proteinase K (black bars) or trypsin (hatched bar). The percentage of each fusion protein that was protease sensitive was determined as described for Fig. 1C. Bars represent the means of three independent trials ± standard errors of the means.

