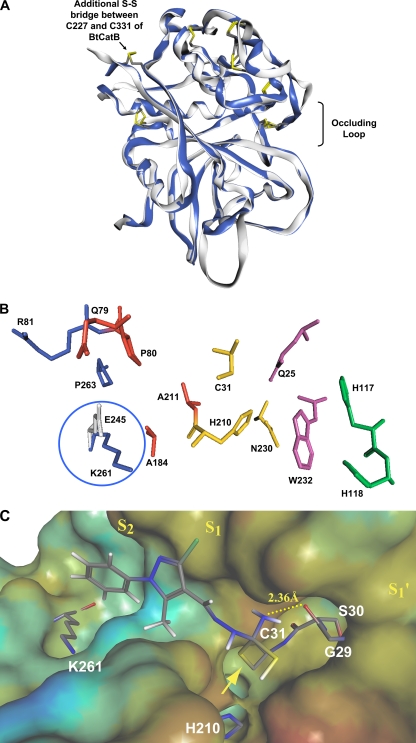
Fig 2.
Modeling the structure of the mature EtCatB. (A) Homology model of EtCatB (gray) in ribbon-type rendering. For comparison, the BtCatB template structure (PDB ID 1QDQ; blue) was superimposed on the model structure. The superimposition exhibits almost identical folding patterns between the model and template structures. Disulfide bridges are depicted in capped-stick representation and colored by atom type (mature enzyme numbering). (B) The main residues of the active-site cleft of the EtCatB homology model. Numbers refer to the EtCatB mature sequence. Residues are shown as follows: S2 subsite in blue, S1 subsite in red, residues of the catalytic triad in yellow, S1′ subsite in magenta, and S2′ subsite in cyan. E245 (gray) from the BtCatB template structure (PDB ID 1QDQ) was superimposed on K261 (blue) of the model structure. The oppositely charged residues K261 and E245 might be addressed in lead optimization approaches to increase the inhibitor selectivity. (C) The top-ranked covalent-docking solution of CP989759 in the active site of EtCatB. The surface of the active site is colored by lipophilic potential. The color ramp ranges from red (highest lipophilic area of the surface) to blue (highest hydrophilic area of the surface). Relevant amino acids of the EtCatB active site and the inhibitor CP989759 are depicted in capped-stick representation and colored by atom type. The yellow arrow marks the covalent bond between C31 and CP989759, forming a tetrahedral transition state.

