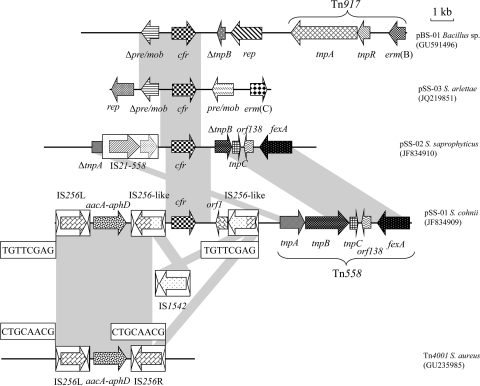
Fig 2.
Schematic presentation of the genetic environment of the cfr gene in plasmids pSS-01, pSS-02, pSS-03, and pBS-01. The arrows indicate the positions and directions of the transcription of the genes. The regions of >96% homology are marked using gray shading. The direct target site duplication is boxed. Δ indicates a truncated gene. A distance scale in kilobases is displayed in the upper right corner.

