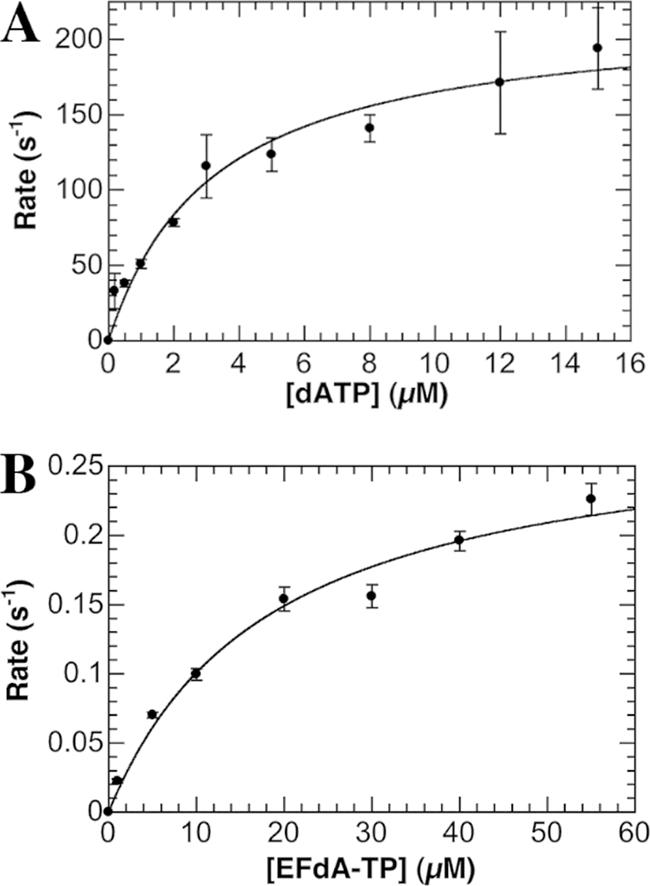
Fig 2.

Concentration dependence of the observed rate of nucleotide incorporation by Pol γ. Each point in the plots represents the observed rate generated from fitting a time course with 10 different points using a double exponential equation (dATP) or a single exponential equation (EFdA-TP) (KaleidaGraph). The error bars in the plots represent the deviance from these exponential fits, and the standard errors associated with the determined rate constant values represent the deviance from the hyperbolic fits shown. (A) Observed rates of incorporation were plotted against dATP concentration and fit with a hyperbolic equation to generate a kpol value of 220 ± 16 s−1 and a Kd value of 3.2 ± 0.7 μM. (B) Observed rates of incorporation were plotted against EFdA-TP concentration and fit with a hyperbolic equation to generate a kpol value of 0.29 ± 0.02 s−1 and a Kd value of 18 ± 4 μM.
