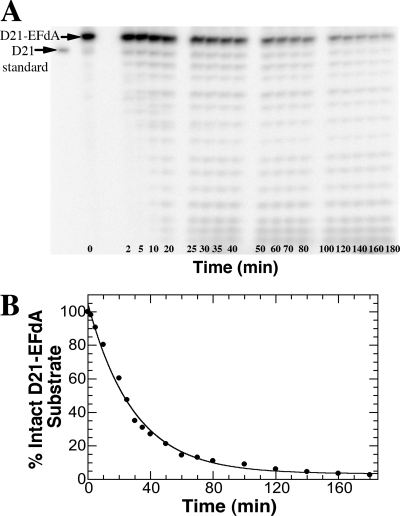
Fig 3.
Excision of EFdA by Pol γ. (A) Gel analysis of the intact D21-EFdA substrate and degradation products over a 3-h time course. (B) A single exponential fitting of a plot of the percent loss of substrate versus time yielded a kexo value of 0.00057 ± 0.00003 s−1. Each point represents a single experiment within the time course, and the standard error associated with the kexo value represents the deviance from this single exponential fitting as calculated by the KaleidaGraph software.

