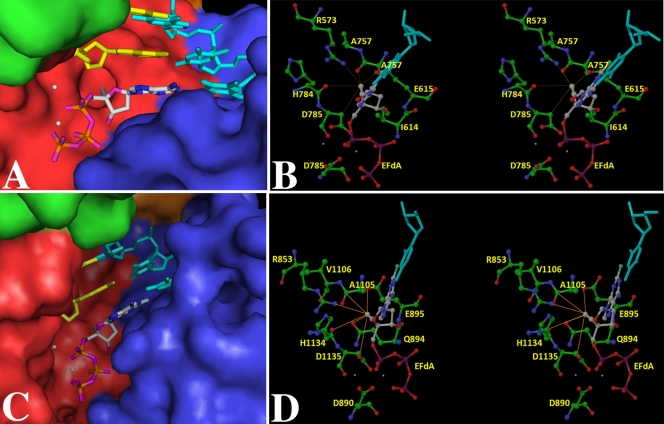
Fig 4.
(A) KlenTaq–DNA–EFdA-TP. (B) KlenTaq–DNA–EFdA-TP in stereo view, highlighting interactions of the 4′-ethynyl group of EFdA-TP with the neighboring amino acid residues. (C) Pol γA–DNA–EFdA-TP. (D) Pol γA–DNA–EFdA-TP in stereo view, highlighting the interactions of 4′-ethynyl group of EfdA-TP with proximal amino acid residues. For (A) and (C), the ternary complex model of the polymerase subunit with template (cyan), primer (yellow), and EFdA-TP (colored by atom type as follows: carbon, gray; nitrogen, blue; oxygen, purple; phosphorous, orange). The enzyme is rendered as a Connolly surface representation with the thumb, palm, finger, and exonuclease domains colored in green, red, blue, and orange, respectively. For clear visualization of EFdA-TP, some residues at the tip of the fingers and thumb have been removed. However, these side chains were part of the computations. The metal ions are depicted as white spheres. For panels B and D, the amino acid residues (colored by atom type as follows: carbon, green; nitrogen, blue; oxygen, red) important for interaction with EFdA-TP (using the same color scheme, except carbon is colored gray and phosphorous purple) are highlighted. The template is shown in cyan. The thin lines depict the possible interactions with the amino acid residues in the vicinity of the 4′-ethynyl group of EFdA-TP. These interactions are not necessarily the hydrogen bonds. Interaction lengths range from 2.9 to 4 Å. Panels A and C were generated by PyMOL (http://www.pymol.org/), and panels B and D were generated by Maestro 9.1 (Schrödinger Inc., NY).

