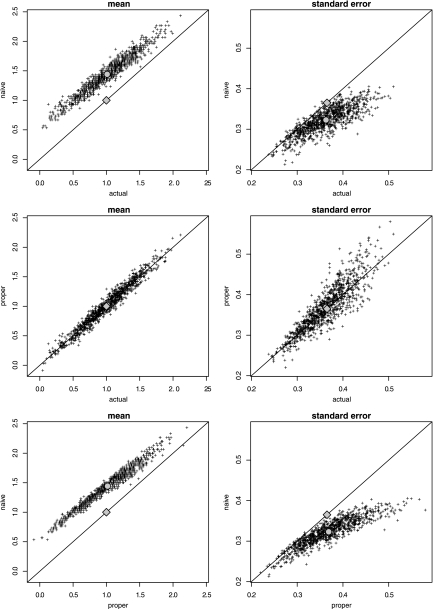
Fig 2.
One thousand runs of 30 samples where the mean (left panels) and standard error of the mean (right panels) were estimated for each run (black dots). The “actual” values are based on the actual values, yact; “naive” values are based on the observed values, yobs (ignoring censoring); and “proper” values are based on the observed values, yobs (accounting for censoring). The true mean (= 1) and standard error (= 2/√30) are indicated by diamonds. The means of the 1,000 estimates are indicated by circles.

