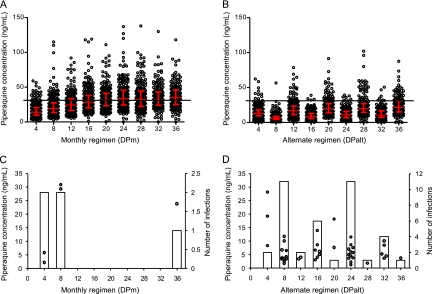
Fig 2.
Plasma piperaquine trough concentrations and incidences of malaria infections. Graphs show individual piperaquine trough concentrations (open circles) with median values and interquartile range (red bars) for DPm (A) and DPalt (B). The solid black horizontal line indicates the piperaquine cutoff concentration of 31 ng/ml above which there were no malaria infections. Five data points in the DPm group (167 ng/ml at week 12, 204 ng/ml at week 24, 167 ng/ml and 180 ng/ml at week 32, 251 ng/ml at week 36) are outside the axis limits. (C and D) Individual piperaquine trough concentrations for subjects that developed a new malaria infection (open circles) are shown on the primary y axis, and the total number of malaria infections for that period (open bars) are shown on the secondary y axis.

