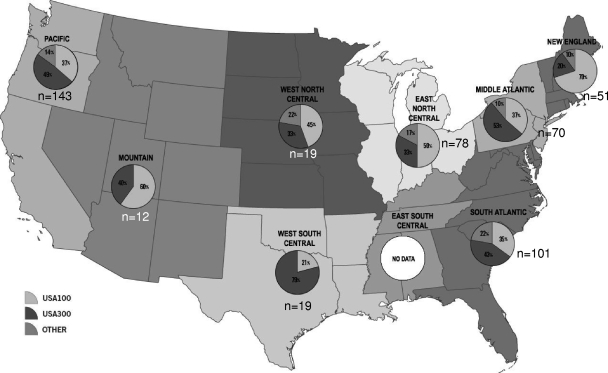
Fig 1.
Proportions of USA100, USA300, and other pulsed-field types from blood culture isolates delineated by U.S. census region. The percentages of USA100 isolates are indicated in light gray, the percentages of USA300 isolates are indicated in dark gray, and other pulsed-field types are indicated in the intermediate gray color. The numbers of isolates obtained from each region are also shown.

