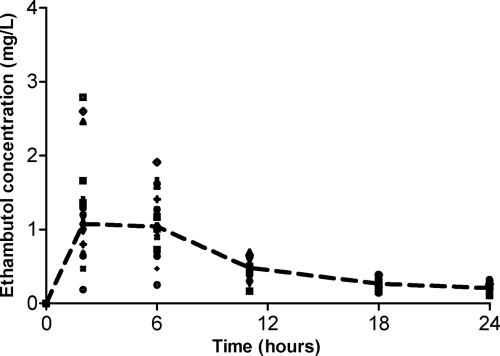
Fig 2.
Concentrations of ethambutol (mg/liter) achieved after administration of a single dose of ethambutol. This line is the median concentration using naive pooling and demonstrates a biphasic decline consistent with a two-compartment model. The circles represent volunteers with a body mass index classified as normal weight.

