
Figure A1.
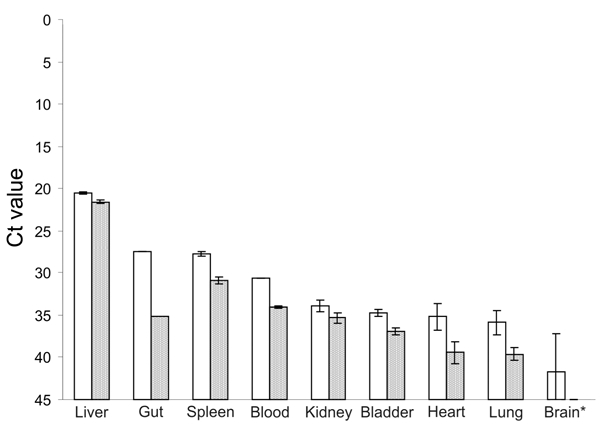
Results of real-time reverse transcription–PCR showing cycle threshold (Ct) values of viral load in different tissues of Norway rats nos. 63 (white bars) and 68 (gray bars). For RNA isolation, 10 mg of tissue or 10 µL of blood were homogenized and used. The PCR was selective for a region in the open reading frame 2 of rat hepatitis E virus (rHEV) and was based on primers rHEV-forward (5′-TACCCGATGCCGGGCAGT-3′) and rHEV-reverse (5′-ATCCACATCTGGGACAGG-3′) and probe (5′-6FAM-AATGACAGCACAGGCACC-BBQ-3′). Error bars indicate SD. *Brain sample from rat no. 63 contained blood.