
Figure A3.
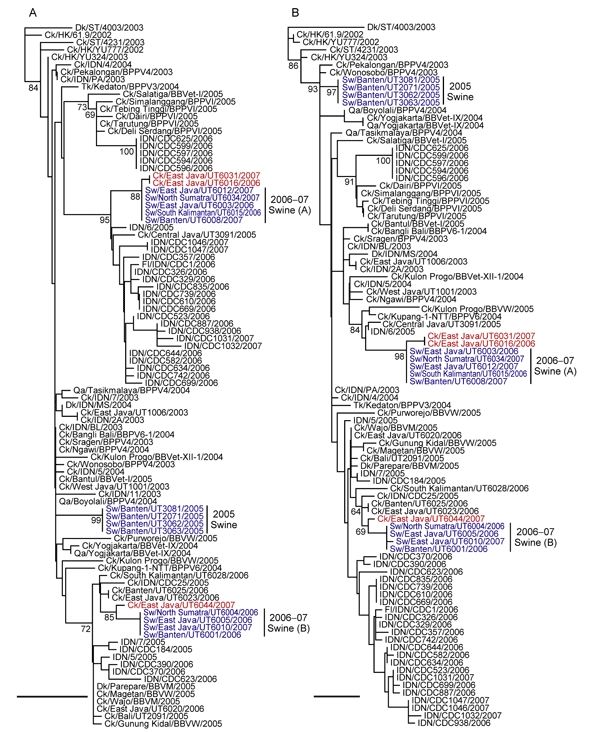
Phylogenetic relationships of the M (A) and NS (B) genes of H5N1 influenza viruses in Indonesia. All trees were generated by the neighbor-joining method in ClustalW (www.clustal.org). Numbers above or below branches indicate neighbor-joining bootstrap values. Analyses were based on nucleotides 77-955 (879 bp) and 64-789 (726 bp) of the M and NS genes, respectively. Each tree was rooted to A/duck/Shantou/4003/03 for M and NS. Colors indicate swine isolates (blue) and chicken isolates (red) most closely related to swine viruses. Scale bar indicates 0.01 nt substitutions per site. Ck, chicken; Dk, duck; Fl, feline; Gx, Guangxi; HK, Hong Kong; IDN, Indonesia; Qa, quail; ST, Shantou; Sw, swine.