Fig 9.
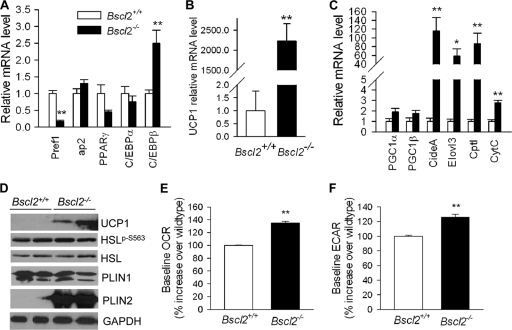
Gene and protein expression in EWAT of wild-type and Bscl2−/− mice in vivo. (A to C) qPCR analyses of genes involved in adipocyte differentiation (A), UCP1 (B), and brown adipose tissue-specific marker genes (C) in EWAT of 13-week-old nonfasting male wild-type and Bscl2−/− mice (n = 6). Data were normalized to 3 housekeeping genes (cyclophilin A, Eelf1γ and β-actin genes) based on the Genorm algorithm (http://medgen.ugent.be/genorm/) and are expressed as fold changes relative to wild-type controls. (D) Western blot analyses of lysates extracted from EWAT of 6-week-old male wild-type and Bscl2−/− mice. Identical amounts of protein were loaded. GAPDH was used as a loading control. (E and F) Baseline OCR (E) and ECAR (F) in day 4 differentiating Bscl2+/+ and Bscl2−/− MEFs. The basal rates shown represent averages of 10 time points each with 4 wells and are presented as percent increases over wild-type baseline values. *, P < 0.05; **, P < 0.005 (between the two genotypes).

