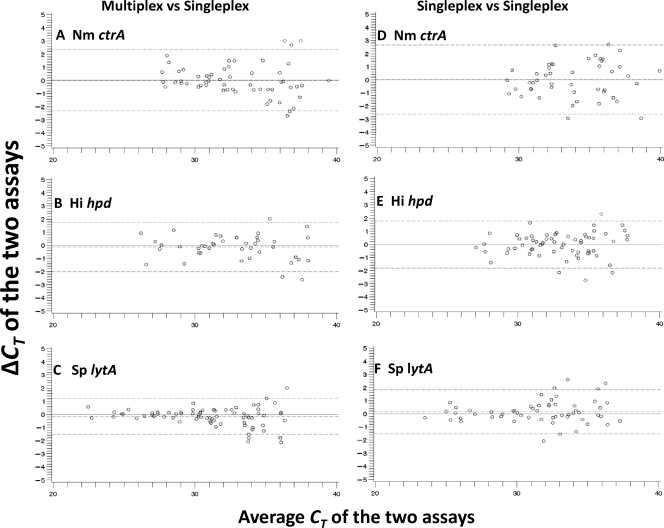
Fig 1.
Pairwise comparison analyses for species-specific PCR assays for N. meningitidis (Nm) ctrA, H. influenzae (Hi) hpd, and S. pneumoniae (Sp) lytA carried out using ABCs isolates. Each assay was compared between multiplex and singleplex (A, B, and C) and between singleplex duplicates (D, E, and F). Shown is the Bland-Altman plot that depicts the cycle threshold difference (ΔCT) between the two assays (ΔCTmultiplex-singleplex [ΔCTm-s] or ΔCTsingleplex1-singleplex2 [ΔCTs1-s2]) as a function of the average CT value of the two assays [(CTmultiplex or singleplex + CTsingleplex)/2]. The reference lines on the plot indicate the ideal zero difference (solid line) and the observed mean CT difference (mean ΔCTm-s or mean ΔCTs1-s2) (middle dashed line), as well as the upper and lower limits of agreement defined by the mean ΔCT ± 1.96 standard deviations (top and bottom dashed lines) (1–3).

