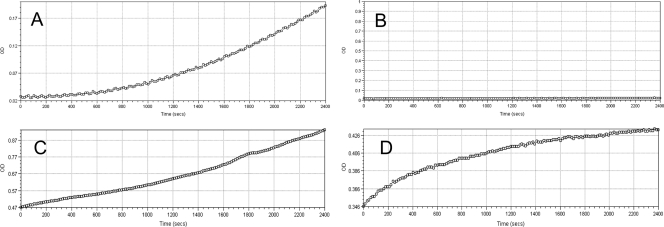
Fig 3.
(A) BG assay kinetic trace of a positive sample without optical artifacts; (B) kinetic trace of a negative control; (C and D) kinetic trace showing optical artifacts. OD, optical density. In panels C and D note initial high OD readings and the absence of initial lag periods consistent with optical artifacts.

