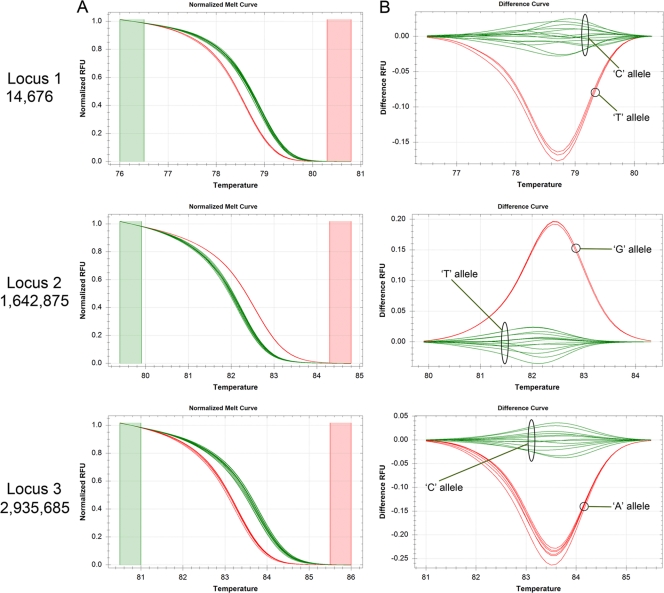
Fig 4.
Real-time PCR-HRM analysis for SNP detection for M. leprae typing (SNP typing assays). Representative real-time PCR-normalized melt curves (A) and differential curves (B) for M. leprae strains analyzed at three SNP loci as indicated beside the panels are shown. The green color was assigned to NHDP63, and the corresponding alleles for each locus are indicated (this is referred to as cluster 1 in Tables 6, 7, and 8). The red curves indicate strains with the alternative allele at each locus (this is referred to as cluster 2 in Tables 6, 7, and 8).

