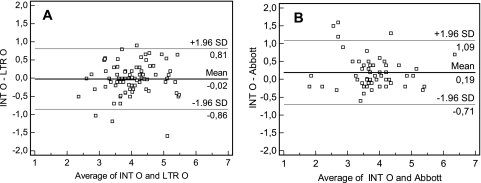
Fig 2.
Degree of agreement in log copies/ml between the viral loads determined by the INT-O, LTR-O, and Abbott RealTime HIV-1 methods. For Bland and Altman curves, the mean values for each sample obtained by the 2 techniques are plotted on the x axis. The differences between the values obtained by the 2 techniques are plotted on the y axis. The solid lines show the mean differences between the values, and the dotted lines show the mean differences plus or minus 1.96 SD (95% limits of agreement). (A) Degree of agreement between viral loads determined by the INT-O and LTR-O methods. (B) Degree of agreement between viral loads determined by the INT-O and Abbott RealTime methods.

