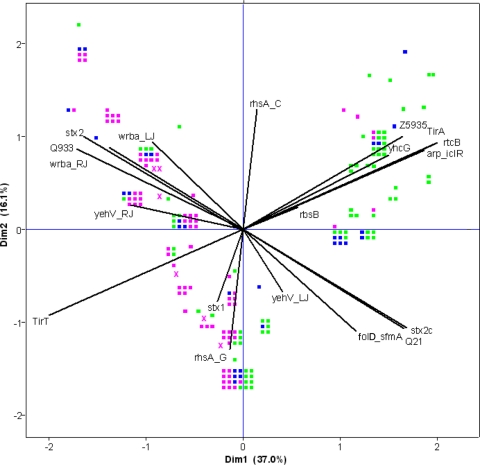
Fig 1.
Ordination plot showing the results of the PCA for all genetic markers tested on STEC O157 isolates from bovine (green squares), food (blue squares), and human clinical cases (pink squares) from The Netherlands. Isolates clustering together have similar genetic compositions. The strength of the contribution of a specific genetic feature to the explained variation is indicated by the projected length of the line on the horizontal and vertical axes. Dim1 and Dim2 represent the first two dimensions of the PCA.

