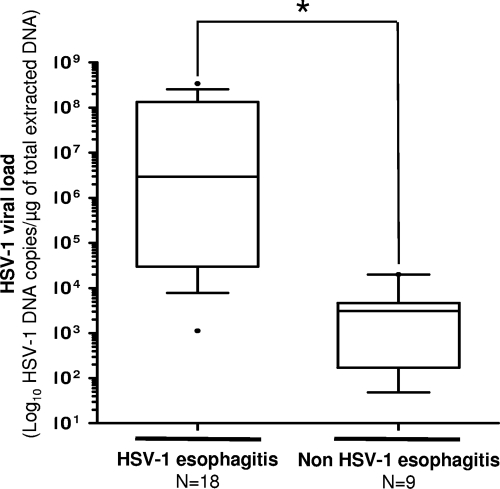
Fig 2.
Box plots showing HSV viral load levels (y axis) in cases of HSV or non-HSV esophagitis (x axis). The lower and upper ends of the box are the 25th and 75th quartiles, respectively. The line across the middle of each box identifies the median value of the HSV viral load in the esophageal specimens tested. The asterisk indicates a statistically significant result (P < 0.05).

