Fig 5.
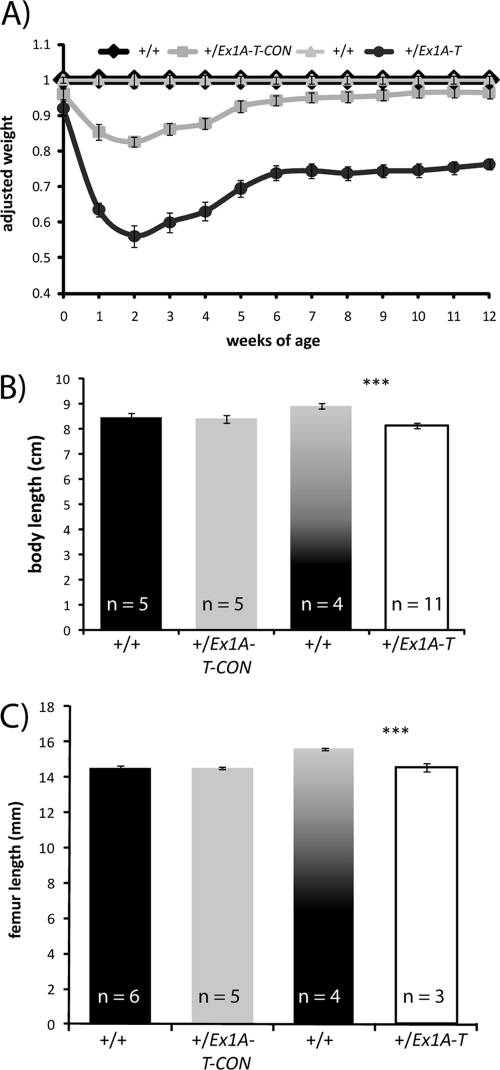
Growth retardation. (A) Growth curve of +/Ex1A-T and +/Ex1A-T-CON mice and their wild-type littermates of both sexes over 12 weeks. Wild-type littermate weights have been normalized to 1 at each time point, and weights of the transgenic mice have been taken as a percentage of wild-type weights at each time point. Error bars indicate the standard errors of the means; n = 14 to 34. (B) Body lengths of 12-week-old-mice, measured from the nose to the start of the tail. Error bars indicate the standard errors of the means; ***, P < 0.01. (C) Femur lengths of 12-week-old-mice. Error bars indicate the standard errors of the means; ***, P < 0.01.

