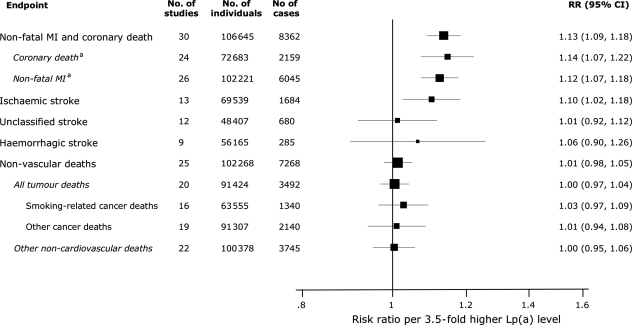
Figure 4.
Risk ratios for various vascular and non-vascular endpoints per 3.5-fold (i.e. 1 SD) higher than usual lipoprotein(a) levels adjusted for cardiovascular risk factors. MI, myocardial infarction. aSubtotals do not add to the total number of coronary heart disease outcomes because some studies did not subdivide outcomes into coronary death and non-fatal MI. RR, relative risk; CI, confidence interval. Modified from The Emerging Risk Factors Collaboration.3

