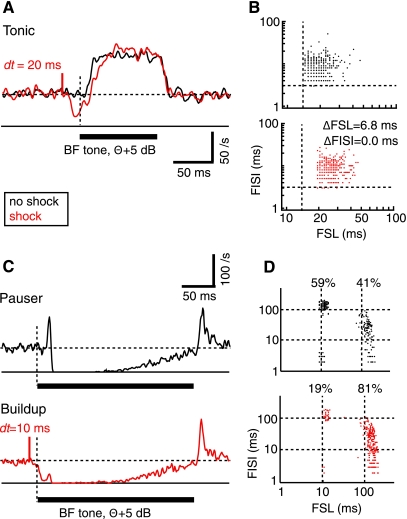
Fig. 1.
Stimulation of dorsal column nuclei (DCoN) suppresses the first spike in response to a best frequency (BF) tone. A and C: responses to acoustic stimuli alone (black) are compared with responses to the acoustic stimuli preceded (with time interval dt) by a single bipolar electrical stimulus pulse in DCoN (red). A: tonic response. C: pauser response from a different neuron. Acoustic stimulus is marked by the heavy horizontal bar. Horizontal dashed line is the spontaneous discharge rate. Short red vertical solid line shows the time of the electrical stimulus, labeled with dt the time delay between the electrical stimulus pulse and the start of the stimulus tone. First spike is delayed in the tonic response in A, and pauser in C is converted to a buildup response by the DCoN stimulus. B and D: scatter plots of the first spike latency (FSL; abscissa) and first interspike interval (FISI; ordinate) measured from responses to individual stimuli. Dashed lines show the minimum first spike latency and first interspike interval in the absence of DCoN stimulation in B. Cell in B showed an increased first spike latency by 6.8 ms (P < 0.05), while first interspike interval did not change (NS). In D, the fraction of stimulus trials giving pauser (short first spike latency) and buildup (long first spike latency) responses is shown. Dashed lines show 10 and 100 ms to aid in lining up the data points. Peristimulus time histograms (PSTHs) are not smoothed.

