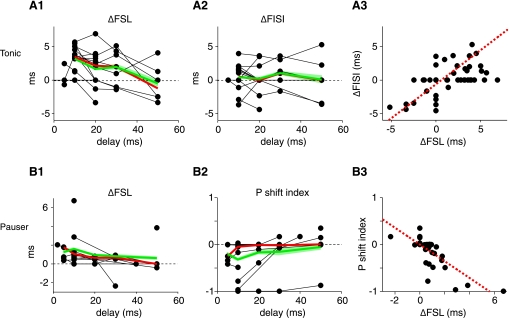
Fig. 2.
Electrical stimulation of the DCoN changes the tone-evoked discharge pattern in tonic (A) and pauser type (B) responses for delays (dt) up to 50 ms. A: changes in first spike latency (A1) and first interspike interval (A2) in tonic cases. Each point is the difference in latency or interspike interval between cases with and without electrical stimulation, plotted vs. dt; only significant (P < 0.05) cases are plotted as non-zero ΔFSL or ΔFISI. Heavy red and green lines show medians and means computed at dt values with 3 or more observations. Green shading indicates the ±1 SE. Note that not all neurons were tested with all latencies. A3: changes in first spike latency and first interspike interval are correlated (dashed red line) (ΔFISI = −0.6076 + 0.4881 * ΔFSL; r2 = 0.338). B: pauser responses. B1: first spike latency increases with electrical stimulation in pauser trials for which the onset spike is not suppressed. B2. Firing mode of pauser responses changes for short dt values. Plotted is the relative change in the number of pauser trials P as defined in the text. P of −1 indicates that all “pauser” trials have converted to “buildup” trials. A P shift index of 0 indicates no change. A3: changes in first spike latency and P are correlated (dashed red line; P index = 0.0009 − 0.1781 * ΔFSL; r2 = 0.611).

