Fig. 3.
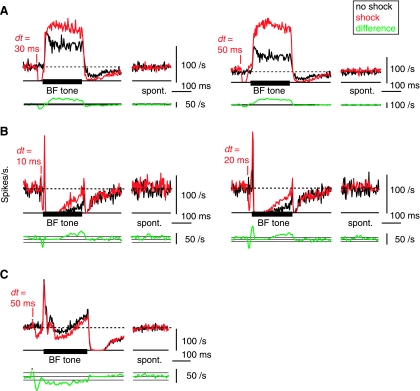
Long-term changes in the tone-evoked firing rate after DCoN stimulation. Examples from 3 neurons in which the effects of a DCoN stimulus pulse lasted for the duration of the 200 ms acoustic stimulus. A: DCoN stimulation at 2 dt values increased the tone-evoked firing rate of a tonic neuron by 41.9 and 108.1%, respectively (top traces); compare the black control PSTHs with the red with-shock PSTHs. Small or no differences occurred in the spontaneous rates (“spont”). To quantify the significance of rate changes, the rate differences (with-shock minus no-shock) are plotted below (bottom green traces, smoothed with 5-bin triangular filter) together with horizontal lines showing ±1 SD of the spontaneous rate from the PSTHs. In A, this SD is too small to see on this scale. Significant rate changes are present where the rate differences are outside the ±1 SD area. Note that large rate differences persist for the duration of the stimulus. B: same for a pauser neuron in which DCoN stimulation also increased the tone-evoked firing rate by 125 and 146.5%, respectively. Also note the increase in the onset peak at dt = 20 ms. Again, no change occurred in the spontaneous rate. C: pauser response in which the long-term effect was a decrease in discharge rate. For this case, the shock and no-shock trials were interleaved on alternating trials, as opposed to A and B where they were interleaved with other stimuli in 100-repetition sets. PSTHs (except rate differences) were not smoothed.

