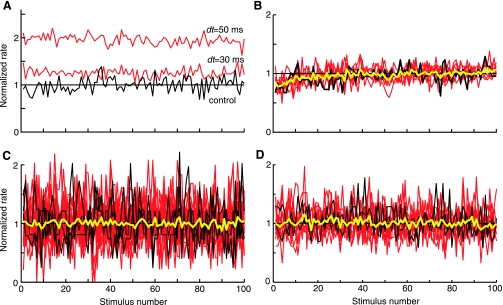
Fig. 4.
Long-term rate changes occur on the first trial of a stimulus set and do not build up over time. A: average discharge rate over the duration of the 100 acoustic stimuli of a stimulus block for the control (black, no shock) and with-shock (red) stimuli at 2 values of dt. Rates are normalized by the average rate during the control stimuli (horizontal line). Same data as Fig. 3A. B: same plot for a similar neuron in which all rates are normalized by the average rate during the last 50 presentations. Yellow line is the average of all the other plots. Rate transients at the start of these stimulus blocks are identical for shock and no-shock cases and presumably are rate adaptation. Despite the adaptation, no trend in rate differences is seen in these data. C and D: same plot for 25 cases in 3 neurons with the largest rate increases (C) and 13 cases in 2 neurons with the largest rate decreases (D). No trend in rate differences are seen across these neurons.

